
Figure: An overview of non-invasive blood component hemoglobin (Hb) measurement technique.
Anemia is a critical public health issue worldwide, especially in developing countries, due to the high prevalence of iron deficiency. Hemoglobin (Hb) concentration is a standard marker for diagnosing anemia, but traditional measurement methods are invasive, requiring blood draws, laboratory processing, and specialized personnel. These procedures are often painful, costly, and inaccessible for routine or large-scale screening—particularly in resource-limited settings. To address these challenges, researchers are increasingly turning toward non-invasive technologies, especially those based on optical principles such as near-infrared spectroscopy (NIRS) and photoplethysmography (PPG) [1–3]. These techniques allow hemoglobin estimation by analyzing the absorption and reflection of light through tissue, offering painless, rapid, and cost-effective alternatives [4–6]. Smartphones and custom-built LED devices now make it feasible to collect fingertip video data for PPG signal extraction, laying the groundwork for portable and accessible hemoglobin monitoring solutions [7–8].
Conventional hemoglobin testing methods are limited by their invasiveness and logistical demands. The need for simple, reliable, and noninvasive alternatives is underscored by the global burden of anemia and the growing focus on patient-centric, at-home health monitoring [1]. Recent advances in optical sensing, combined with the ubiquity of smartphones, have opened new possibilities for real-time, pain-free Hb estimation [5–8]. By leveraging PPG signals captured via consumer devices and applying advanced machine learning techniques [9–10], noninvasive hemoglobin monitoring can be democratized—making frequent self-assessment feasible for at-risk populations. The motivation behind this work is to develop and validate a low-cost, user-friendly solution that minimizes discomfort and barriers to care, supporting early diagnosis and management of anemia in both clinical and remote settings [1,11].
The core objectives of this thesis are to:
The system integrates a custom NIR-LED board with a smartphone camera to acquire fingertip videos under various lighting conditions [7]. The board is user-friendly, portable, and features multiple NIR LEDs to enhance signal quality.
Fingertip videos were collected from subjects (aged 15–65, various genders) under three scenarios: (1) smartphone with built-in flash, (2) smartphone with NIR-LED board (no flash), and (3) reference blood sample collection. Each video was 10+ seconds (600 frames at 60 fps), with the index finger positioned on the illuminated board [8].
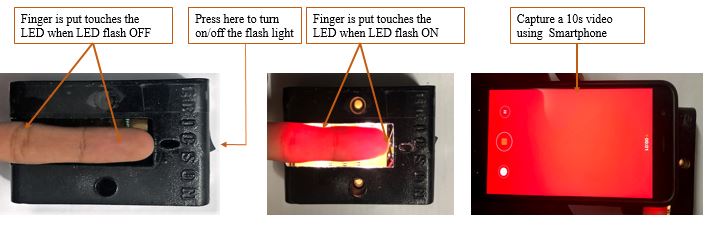
Figure: Video Data Collection Kit with LED-Board.
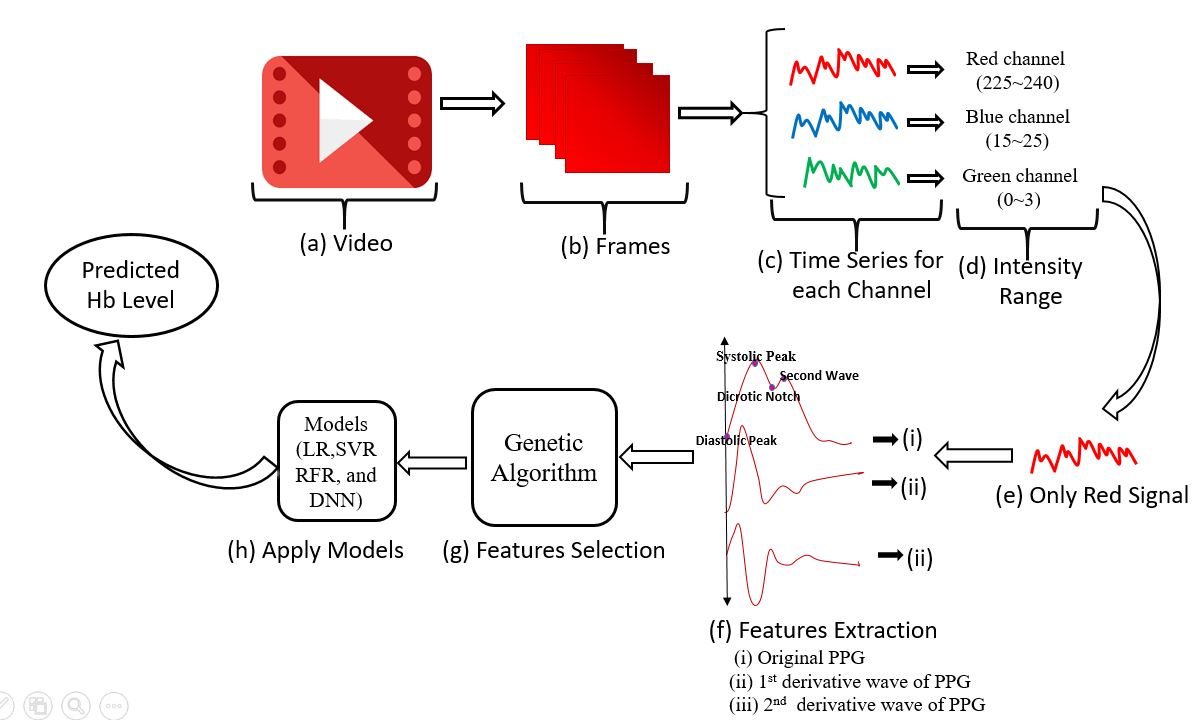
For each video, the central 500x500 pixel region was extracted from every frame, and the mean red channel intensity was computed to generate the raw PPG signal [4]. A fourth-order Butterworth bandpass filter was applied to suppress noise and motion artefacts [9]. The three highest-quality PPG waveforms (with prominent systolic peaks) were selected for further analysis.
Comprehensive feature extraction was performed on each PPG cycle, including analysis of the original signal, its first and second derivatives, and frequency-domain characteristics [4,9]. Feature selection leveraged genetic algorithms to optimize the subset for model input, reducing redundancy and overfitting [10,11].
Multiple regression models (Linear Regression, Support Vector Regression, Multilayer Perceptron Regression, Deep Neural Networks) were trained using the selected features. K-fold (K=10) cross-validation was used for robust performance evaluation [10].